|

Half the Battle: Understanding the impact of 'the Troubles' on children and young people - Chapter 3: Deaths of children and young people in the Troubles
[Key_Events] [Key_Issues] [Conflict_Background] VIOLENCE: [Menu] [Reading] [Summary] [Background] [Chronology] [Incidents] [Deaths] [Statistics] [Sources] The Cost of the Troubles Study: [Menu]
3. Deaths of children and young people in the Troubles
3.1 Compilation of the database on deaths in the Troubles in Northern Ireland
There are a variety of approaches to counting the deaths in the
Northern Ireland conflict, which are described in detail in Fay,
Morrissey and Smyth (1997). This is manifest by the inconsistencies
between the lists, and the various manners and criteria by which
they have been compiled. For example, list lengths vary from around
3,400 deaths to over 4,000. The database analysed here was compiled
using data from Isobel Hylands, a cross-community volunteer from
Lurgan, the Irish Information Partnership's published list, RUC
statistics and Sutton's (1994) published list. In addition, we
referred to Holland and McDonald's (1994), INLA: Deadly Divisions;
Bruce (1992) The Red Hand; Flackes and Elliott's (1994),
Northern Ireland: A Political Directory; de Baroid's (1989)
Ballymurphy and the Irish War and Survivors of Trauma's
list of deaths for the greater Ardoyne area (see Fay, Morrissey
and Smyth, 1997 for a full account of this process). Using these
sources and cross checks, we collected and cross-checked information
on the date of the death, name of victim, age, gender, cause of
death, town of incident, religious and political affiliation,
occupation, organisation responsible for the death and, where
possible, a complete address of where the death occurred. Our
criteria for inclusion have meant that our list is longer than
any of the other main sources: RUC; Hylands; or Sutton. We have
collected data on over 3,600 deaths due to Northern Ireland's
Troubles. The list enables the systematic examination of the geographic
and age distribution of all Troubles-related deaths both inside
and outside Northern Ireland from August 1969 until March 1998.
3.2 Statistics on deaths of children and young people
An examination of those killed in the conflict since 1969 illustrates
the particularly vulnerable situation of children and young people.
An age breakdown of deaths in the Troubles as shown in Table 1
reveals that of all age groupings examined, the 18-23 age group
contains the highest number of deaths - 898. This age group alone
accounts for 25% of all deaths in the Troubles. People of 29 years
and under account for over half the deaths in the Troubles to
date.
Deaths from 1969 - 1.3.1998 in the Northern Ireland Troubles by age grouping
When we reorganised the age categories so that we could compare
them with census categories the following picture emerged. (Table
2)
Children and young people killed in the Troubles 1969-1.31998 by age grouping, total population in age group and death rate for age group
Table 2 shows the numbers killed in each age group up to the age
of 24, with a death rate for the age group which can be compared
to the overall death rate of 2.23 per thousand for the total population.
Both the 15-19 and the 20-24 age groups show a death rate that
is higher than that for the total population.
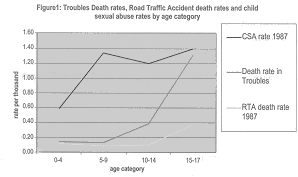
child sexual abuse rates by age category
If we compare children's risk of death through armed conflict
in Northern Ireland with other childhood risks, which are present
in all societies, namely those of childhood sexual abuse, and
road traffic death, two features become distinct. First, the massive
difference in levels becomes apparent, in Figure 1 which shows
the overall death rate in the Troubles (1969-1998) compared
to the road traffic accident rate and child sexual abuse rate
for just one year - 1987. Clearly, in comparison to both death
due to road traffic accident and risk of childhood sexual abuse,
risk of death in the Troubles is a much lesser risk. The overall
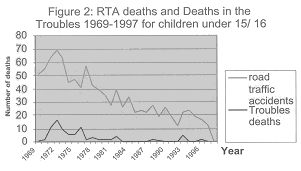
difference in Troubles related deaths in the under 18 and Road
Traffic Accident Deaths in under 17s is shown in Figure 2.
 Second, in spite of the overall difference in level, the pattern of risk by age in all three cases can be compared. When the death rate per thousand in the Troubles is compared with the rate of childhood sexual abuse for the same ages, several divergences emerged. Appendix 1 shows Kennedy et al (1990)'s calculations of expected rates for each age category. (The death risk in the Troubles and road traffic accident rates have been added to Kennedy's table. The data for deaths due to both the Troubles (1969-1998) and road traffic accidents (1987) was used to calculate death risk using the same population baselines as Kennedy.) In comparing the child sexual abuse rate and the death rate, it is important to note that one is not comparing like with like. The childhood sexual abuse figures do not differentiate between the severity of cases, whilst the Troubles death rate takes only the most extreme case, where the child was killed. The comparison with road traffic deaths is a much better comparison in that sense. However, if we compare the pattern of risk by age for both childhood sexual abuse and death rate in the Troubles, the rise in rate as age increases in the case of sexual abuse and Troubles related death shows a markedly different pattern. The increase in rate between the last two age categories is very marked in the case of Troubles-related death risk, but not so marked in the case of sexual abuse. In the case of childhood sexual abuse the risk rises at an earlier age. However, if we compare children's deaths in road traffic accidents for the same age groups, the changes in rate are much more like the changes in the Troubles - related death rates. Figure 1 plots the three rates. It would appear that the risk of death in the Troubles and the risk of road accident death both increase at about the age when a child attains greater independence and mobility outside the home. Childhood sexual abuse appears to be a much more constant risk in childhood after the age of three or four, whereas both the death rate in the Troubles and the road traffic death rate steeply rises at a much later age. Somewhere after the age often, the death rate rises, suggesting that whilst the risk from the Troubles and the risk from childhood sexual abuse are both more marked for older children, the pattern of risk for younger children is different. The "onset" of significant Troubles-related risk - and risk from death in road traffic accidents - occurs at a later age.
Table 3 shows in more detail how the death rate rises from around
age 12 onwards, peaking around 19 or 20. Clearly adolescence is
a high-risk period, and only in early adulthood does the death
risk begin to diminish. However the risk remains relatively high
for young adults, and one only sees substantial diminution after
the age of forty. However, the risk for those in their late teens
and early twenties is unmatched by any other age group. If we
see death as a surrogate for the effect of the Troubles as a whole,
we can surmise that similar patterns will occur amongst the population
of those injured in the Troubles. High levels of participation
by young people in rioting and other street activities ensures
that in relation to injury, young people are also the highest
risk group.
Death rates at each age 1969-1.3.98
Age is clearly only one factor in death rates in the Troubles.
Table 4 shows a breakdown of deaths by gender and age at death
up to age 24. This table also shows a cumulative total percentage
of all deaths.
Whilst the risk for female children of childhood sexual abuse
is much greater than for males, in the case of death in the Troubles,
this is reversed.
Death rates at each age 0-24 1969 - 1.3.98
In both genders, death rate is related to age. The highest number
of deaths is at the age of 19 and 20, with declining death rates
for all age groups thereafter. Twenty-year-old males are 13.48%
of all males under 24 killed, whist 19-year-old females are 15%
of all females under 24 killed. Deaths of people aged 24 and under
account for 35.46% of all deaths in the Troubles, whilst people
of aged 24 and under account for roughly 40% of the total population.
The data on age demonstrates how Northern Ireland's Troubles have
been a killer of young people, particularly young men. Again,
one can see the death rate steadily rise as age increases from
birth onwards, and beginning to rise substantially at around the
age of 12 to 14 years old. Gender as a factor in the social context,
particularly in relation to the culture of violence will be discussed
below. 3.2.2 Geographical distribution Table 5 shows the distribution of death of those under the age of 25 and those under the age of 18 by the home postal area of the victim. For Northern Ireland deaths, the postal area is given, and for deaths outside Northern Ireland, the region is given. Since British soldiers could serve in Northern Ireland in the early 1970s from the age of 16, some of the deaths under 18 shown with home addresses in Great Britain deaths are British soldiers. The age for serving in Northern Ireland was subsequently raised to 18, yet still, a substantial number of the 353 people killed in England, Scotland and Wales under the age of 25 were members of the British Army.
What emerges from the rest of the table is that the Northern Ireland
deaths are concentrated in a relatively small area in Northern
Ireland. The six Northern Ireland postal areas BT11-15 and BT48
account for 33.5% of all deaths under the age of 25 and an astounding
58% of all deaths under the age of 18. What emerges from this
is that certain sub-groups of children and young people are identified
as being particularly at risk of becoming victims (or perpetrators)
of violent acts, namely young males, resident in these areas where
the overall death rates are particularly high.
Table 5: Troubles-Related Deaths of Children and young People
Under the Ages of 25 and 18 by Postal Area in Northern Ireland
and by other locations: 1969-1.3.98. Ranked by number under 25
killed.
3.2.3 Spatial distribution throughout Northern Ireland The gender disparity in death risk is accompanied by a highly localised distribution of violent deaths, with the highest risk areas being the urban areas - North and West Belfast and Derry Londonderry. Generally it is these same areas that experience the highest levels of deprivation and family poverty. Not only do children live with this poverty, but they also live with the effects of militarisation, and the interplay between violence and deprivation. The relationship between deprivation and the spatial distribution of Troubles-related deaths is dealt with more fully elsewhere (Fay, Morrissey and Smyth (1997).
The implications for Northern Ireland's children are that some
children in the worst affected areas are likely to have a great
deal of experience of the violence of the Troubles, whilst others
have very little experience. This has had major ramifications
for our understanding of the situation of children in Northern
Ireland. Because of the localisation of conflict, research that
takes a representative sample of young people in Northern Ireland
will tend to over-estimate the experiences of children in low
violence areas like Bangor, whilst underestimating the experience
of children in high violence areas such as North or West Belfast.
To speak of the "average Northern Irish child's" experience
is, as was pointed out earlier, somewhat misleading, since children's
experience is widely diverse, with a substantial number of children
having little experience of the Troubles, and a relatively small
number of children having very intense and concentrated and prolonged
experiences of life-threatening Troubles-related events.
3.3.1 Perpetrators of killings of those under 18 In the case of the under I 8s, the IRA are responsible for the largest number of deaths, followed by the British Army, but the variation in the scale of difference in the two age groups is not quite as marked. In the under 25 age group, the IRA were responsible for by far the largest number of killings and the difference between them and the next largest - the British Army -was quite marked (610 to 182) - whilst the difference in the under 18 age group is not as great (73 to 58).
Suicides, where there is an indication that the suicide was related
to the Troubles, are included among the unattributable deaths
in Table 6. Similarly, road accidents where the Troubles were
a causative factor in the accident leading to the death are included.
This means that these figures are somewhat higher than the official
figures, which exclude these deaths. We have also included a number
of deaths in crossfire where it has not been possible to attribute
the death to anyone perpetrator and we have included deaths of
children killed by Army vehicles. 3.3.2 Religious affiliation of children and young people killed
Table 7 shows the numbers of those under 25 and those under 18
who have been killed, according to the community they have been
identified with.
*Non Northern Ireland refers to those who are not residents of Northern Ireland What Table 7 shows is that in both age groups Catholics are the largest group. However, the startling difference between them is that whilst Catholics are just over 48% of those under 25 killed, they are almost 74% of those killed under the age of 18.
In the total death figures for all age groups, Catholic deaths
outnumber Protestant deaths both in relative and absolute terms,
but the scale of the difference is much less than it is for the
under 18 age group. The higher number of Catholics killed, together
with the information in Table 6 on perpetrators, would suggest
that a substantial number of Catholic deaths is due to Republican
paramilitaries. Republican paramilitaries are responsible for
the largest percentage of deaths of any group in both the under
25 age group (55%) and the under 18 age group (34.6%). Republican
paramilitaries are responsible for 58.8% of all deaths, compared
to 55% of those under the age of 25 and 34.6% of those under the
age of 18. Loyalist paramilitaries are responsible for 27.9% of
all deaths, compared to 21.3% of deaths under the age of 25 and
28.8% of deaths under the age of 18. Security forces are responsible
for 11.25% of all deaths, 17.5% of deaths under the age of 25
and 26.1% of deaths under the age of 18. Although Republican paramilitaries
remain the most responsible for deaths at all ages, there is a
marked increase in the share of total deaths of young people due
to the security forces, and this is particularly striking in deaths
under the age of 18. Table 8 examines the political affiliation of those killed in the two age groups. Civilians were 45.6% of those under the age of 25 killed, and 79% of those under 18 killed. Security forces were 34.2% of those under 25 killed, and only 1.95% of those under 18 killed. Republican paramilitaries composed 15.7% of those under 25 killed, and 18.68% of those under 18 killed. Finally, Loyalist paramilitaries were 3.3% of those under 25 killed, and 2.72 % of those under 18 killed.
Clearly, most children and young people killed in the Troubles
were civilians, especially in the under 18 age group. However,
children and young people have also been combatants. If we are
to judge by the death figures, the grouping within whose ranks
children and young people are most likely to die as combatants
are the Republican paramilitaries, the IRA (21) and their junior
wing, Na Fianna (14), with the Official IRA having 3 combatants
under 18 killed, and 2 in the Fianna branch of their organisation.
However, both other categories of combatants - Loyalist paramilitaries,
(UDA with 4 deaths and UVF with 3) and the security forces (British
Army with 5 deaths, 3 of whom died in England)- have also
recruited and armed persons legally defined as children. Deaths
of combatants under 18 peaked in 1972, with 18 combatants under
the age of 18 dying that year. Deaths of combatants under 18 subsequently
declined, with the British Army no longer sending soldiers under
18 to serve in Northern Ireland - although they continue to be
recruited into the army -an obvious change of strategy on their
part.
The most frequent cause of death in the Troubles in both children
under the age of eighteen and those under the age of 25 is shooting,
followed by explosions, as is shown in Table 9. Together these
account for 224 or 87% of all deaths of children under the age
of eighteen. In those under 25, shooting and explosion have killed
1186 people, 93% of all those killed under the age of 25. The
use of armoured vehicles, where the driver's vision of small objects
is restricted, and where vehicles come under attack by stones
and other missiles, requiring them to move fast in restricted
spaces constitutes a hazard to children in heavily militarised
areas. There are no reliable figures for the numbers of children
and young people who have been killed and injured in this manner,
but the cases that are verifiable are included here. A number
of deaths due to rubber and plastic bullets are also shown. Table
10 shows a further analysis of these deaths which have particular
relevance to children and young people. Table 9: Cause of death 1969 - 1.3.1998
Policing policy in Northern Ireland has developed in a context where street violence and rioting is a frequent occurrence. Successive security strategies have variously deployed CS gas, water cannon and, most consistently, rubber bullets and plastic bullets. Rubber bullets were used initially, and these were later replaced by plastic bullets, in response to complaints about the severity of injury caused by the earlier rubber bullet.
Source: Sunday Tribune 13.11.91 Since these bullets, also referred to as baton rounds, are used in riot situations against unarmed combatants, they are frequently deployed in situations involving young people and children. The purpose of such weapons is to disable people temporarily, and thereby control the situation.
However, by 1991, the use of plastic bullets in Northern Ireland
had led to the deaths of an estimated seventeen people, (see Table
10) ten of whom were aged eighteen or under. RUC officers fired
four of the fatal bullets, and members of the British army fired
the remainder. Numbers of others have been injured, some very
seriously and permanently, by plastic and rubber bullets. Arguably,
children are more vulnerable because of the size of the bullet,
relative to the size of a child's body. There has been a campaign
to ban the use of plastic bullets in crowd control and riot situations
because of the danger to children. 3.4.2 Punishment beatings and shootings In situations where civil conflict arises, the breakdown or erosion of normal law enforcement is commonplace. Children can grow up with mixed and confusing messages about the law and where it intersects with what has come to be called in Northern Ireland "anti-social behaviour". The real erosion of law enforcement, and the crisis in the acceptability of the security forces, particularly but not exclusively in Catholic areas, has meant the growth of "community policing" by paramilitary organisations. Much of this activity is in the areas that have seen the worst of the Troubles-related violence, and much of the punishment is ostensibly directed at curbing anti-social behaviour including drug-related behaviour. The issue of drugs and substance abuse is discussed in greater depth later.
In general, official figures would suggest that Northern Ireland
is a more law-abiding society in general, than for example the
rest of the United Kingdom. However, the reluctance, particularly,
though not exclusively, in Catholic areas to report crime to the
police, or to call on the police to intervene, would indicate
that the true extent of the law and order problem may be underestimated
in official figures. Local communities are divided on the issue
of policing of communities, with some advocating paramilitary
policing in the absence of an acceptable state police force, and
others horrified at the brutality of the punishments meted out,
and the summary nature of the attribution of guilt. These kinds
of dilemmas and the practice of summary punishment at the hands
of local people can be seen in other societies that have experienced
conflict. Lynching and beatings as punishments for petty crime
are administered in, for example, Guatemala and South Africa in
local communities. In Northern Ireland, this kind of punishment
can range from attacks with sticks and iron bars, to extremely
brutal beatings, and in one case the impaling of the victim's
anns and legs. Tables 11-13 show the totals for such attacks and
the numbers of young people attacked. Table 11: Casualties under 20 as a result of punishment shootings
Beatings in some areas operate on a tariff system, where repeated offences can lead to the victim being ordered to leave the country within a specified number of hours. At least one voluntary organisation facilitates the flight of young people in order to help them avoid the ultimate sanction - the death penalty. The victims of such beatings are almost invariably male, working class and in their teens or early twenties. Two recent cases concern young men with mild learning difficulties, who were involved in petty crime, and who "defied" the local IRA. In one case, the victim's family took to sleeping in one room, in anticipation of the regular paramilitary raids on the house (which broke the door down) to look for the offender.
According to Northern Ireland Office statistics, in the period
1973-1997, a total of 2,096 people were victims of "punishment
shootings," 214 of whom were under the age of 20. A further
1,283 people were casualties of "punishment beatings"
in the period 1982-1997, and of those 287 were under the age of
20.
Source: Central Statistical Unit Table 13 show the figures for casualties under 20 years old. In terms of shootings, Loyalists shoot four times the number of young people under 17 years of age, whilst the Republican figure was slightly higher than the Loyalist for those 17-19 years old. In the case of punishment beatings, the Republican figure was substantially higher for both age groups.
Yet undoubtedly, a proportion of the local community look to the
IRA and other paramilitary groups to "police" the area
in an attempt to control the level of local crime against the
community. In the absence of acceptable and effective policing,
there is a demand for some form of summary justice. Whilst some
members of the local community are undoubtedly horrified at the
brutality of the punishments meted out, others take a hard line,
particularly around the issue of drugs, and violence against vulnerable
members of the community. Therefore those who offend, often those
already marginalised from the education system and other systems,
can end up fugitives within their own communities, and their families
fearful and resentful.
1991-1997
Source: Central Statistical Unit The issue of punishment beatings and shootings have been a focus of concern in the last number of years, and is likely to remain so whilst the social fabric of communities remains damaged by the attritional effects of militarisation. Such practices also fill a gap created by the absence of consensus on policing within local communities.
| |||||||||||||||||||||||||||||||||||||||||||||||||||||||||||||||||||||||||||||||||||||||||||||||||||||||||||||||||||||||||||||||||||||||||||||||||||||||||||||||||||||||||||||||||||||||||||||||||||||||||||||||||||||||||||||||||||||||||||||||||||||||||||||||||||||||||||||||||||||||||||||||||||||||||||||||||||||||||||||||||||||||||||||||||||||||||||||||||||||||||||||||||||||||||||||||||||||||||||||||||||||||||||||||||||||||||||||||||||||||||||||||||||||||||||||||||||||||||||||||||||||||||||||||||||||||||||||||||||||||||||||||||||||||||||||||||||||||||||||||||||||||||||||||||||||||||||||||||||||||||||||||||||||||||||||||||||||||||||||||||||||||||||||||||||||||||||||||||||||||||||||||||||||||||||||||||||||||||||||||||||||||||||||||||||||||||||||||||||||||||||||||||||||||||||||||||||||||||||||||||||||||||||||||||||||||||||||||||||||||||||||||||||||||||||||||||||||||||||||||||||||||||||||||||||||||||||||||||||||||||||||||||||||||||||||||||||||||||||||||||||||||||||||||||||||||||||||||||||||||
CAIN
contains information and source material on the conflict
and politics in Northern Ireland. CAIN is based within Ulster University. |
|
|||
|
Last modified :
|
||
|
| ||