Visualising the Conflict
Geographic Information Systems (GIS) Maps
Map Set 21:
Deaths Close to Peacelines
Maps drawn by Luke Kelleher; text by Martin Melaugh |
| Map Set 21: Deaths Close to Peacelines - Introduction |
Maps - Deaths due to the conflict, close to selected peacelines in Belfast, and distribution of Catholics of adjoining wards (7 maps)
 This set of maps plots the location of seven 'peacelines' in Belfast and examines the location and number of deaths in the three years prior to, and the three years following, their construction. The peacelines shapefile was downloaded from the Northern Ireland Statistics and Research Agency.
Using the GIS software, a 250 metre and a 500 metre ‘buffer zone’ was drawn around each peaceline. Two separate data files were plotted on the GIS. The first file contained the locations of deaths for the three years prior to the year of erection of the peaceline. The second file plotted the locations of deaths which occurred in the three years after the year of erection of the peaceline. Due to an absence of information on the precise timing for when the peaceline was built, it was decided to omit deaths during the year of erection from the analysis.
Unfortunately one immediate problem arose with the information on the 22 peacelines constructed in Northern Ireland (16 of which were erected in Belfast); the Northern Ireland Office (NIO) had accurate records in terms of the year of construction for only seven of the peacelines. It was therefore decided to conduct a tentative analysis of deaths close to these seven barriers. The table below details the seven peacelines analysed.
This set of maps, also illustrates the distribution of the Catholic population. Data is mapped at electoral ward level and is based on the 2001 Northern Ireland Census survey results. The religious background data was downloaded from the Northern Ireland Statistics and Research Agency.
The table used was titled Table 7S07b Community Background: Religion or Religion Brought Up In. The electoral ward shapefile was downloaded from EDINA borders website.
| Maps - Deaths due to the conflict, close to selected peacelines in Belfast, and distribution of Catholics of adjoining wards (7 maps compiled and drawn by Luke Kelleher) |
| Title of Map |
File Version |
| PDF
| L-JPG
| H-JPG
|
Deaths - Peaceline - Alexandra Park
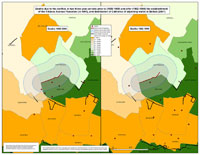
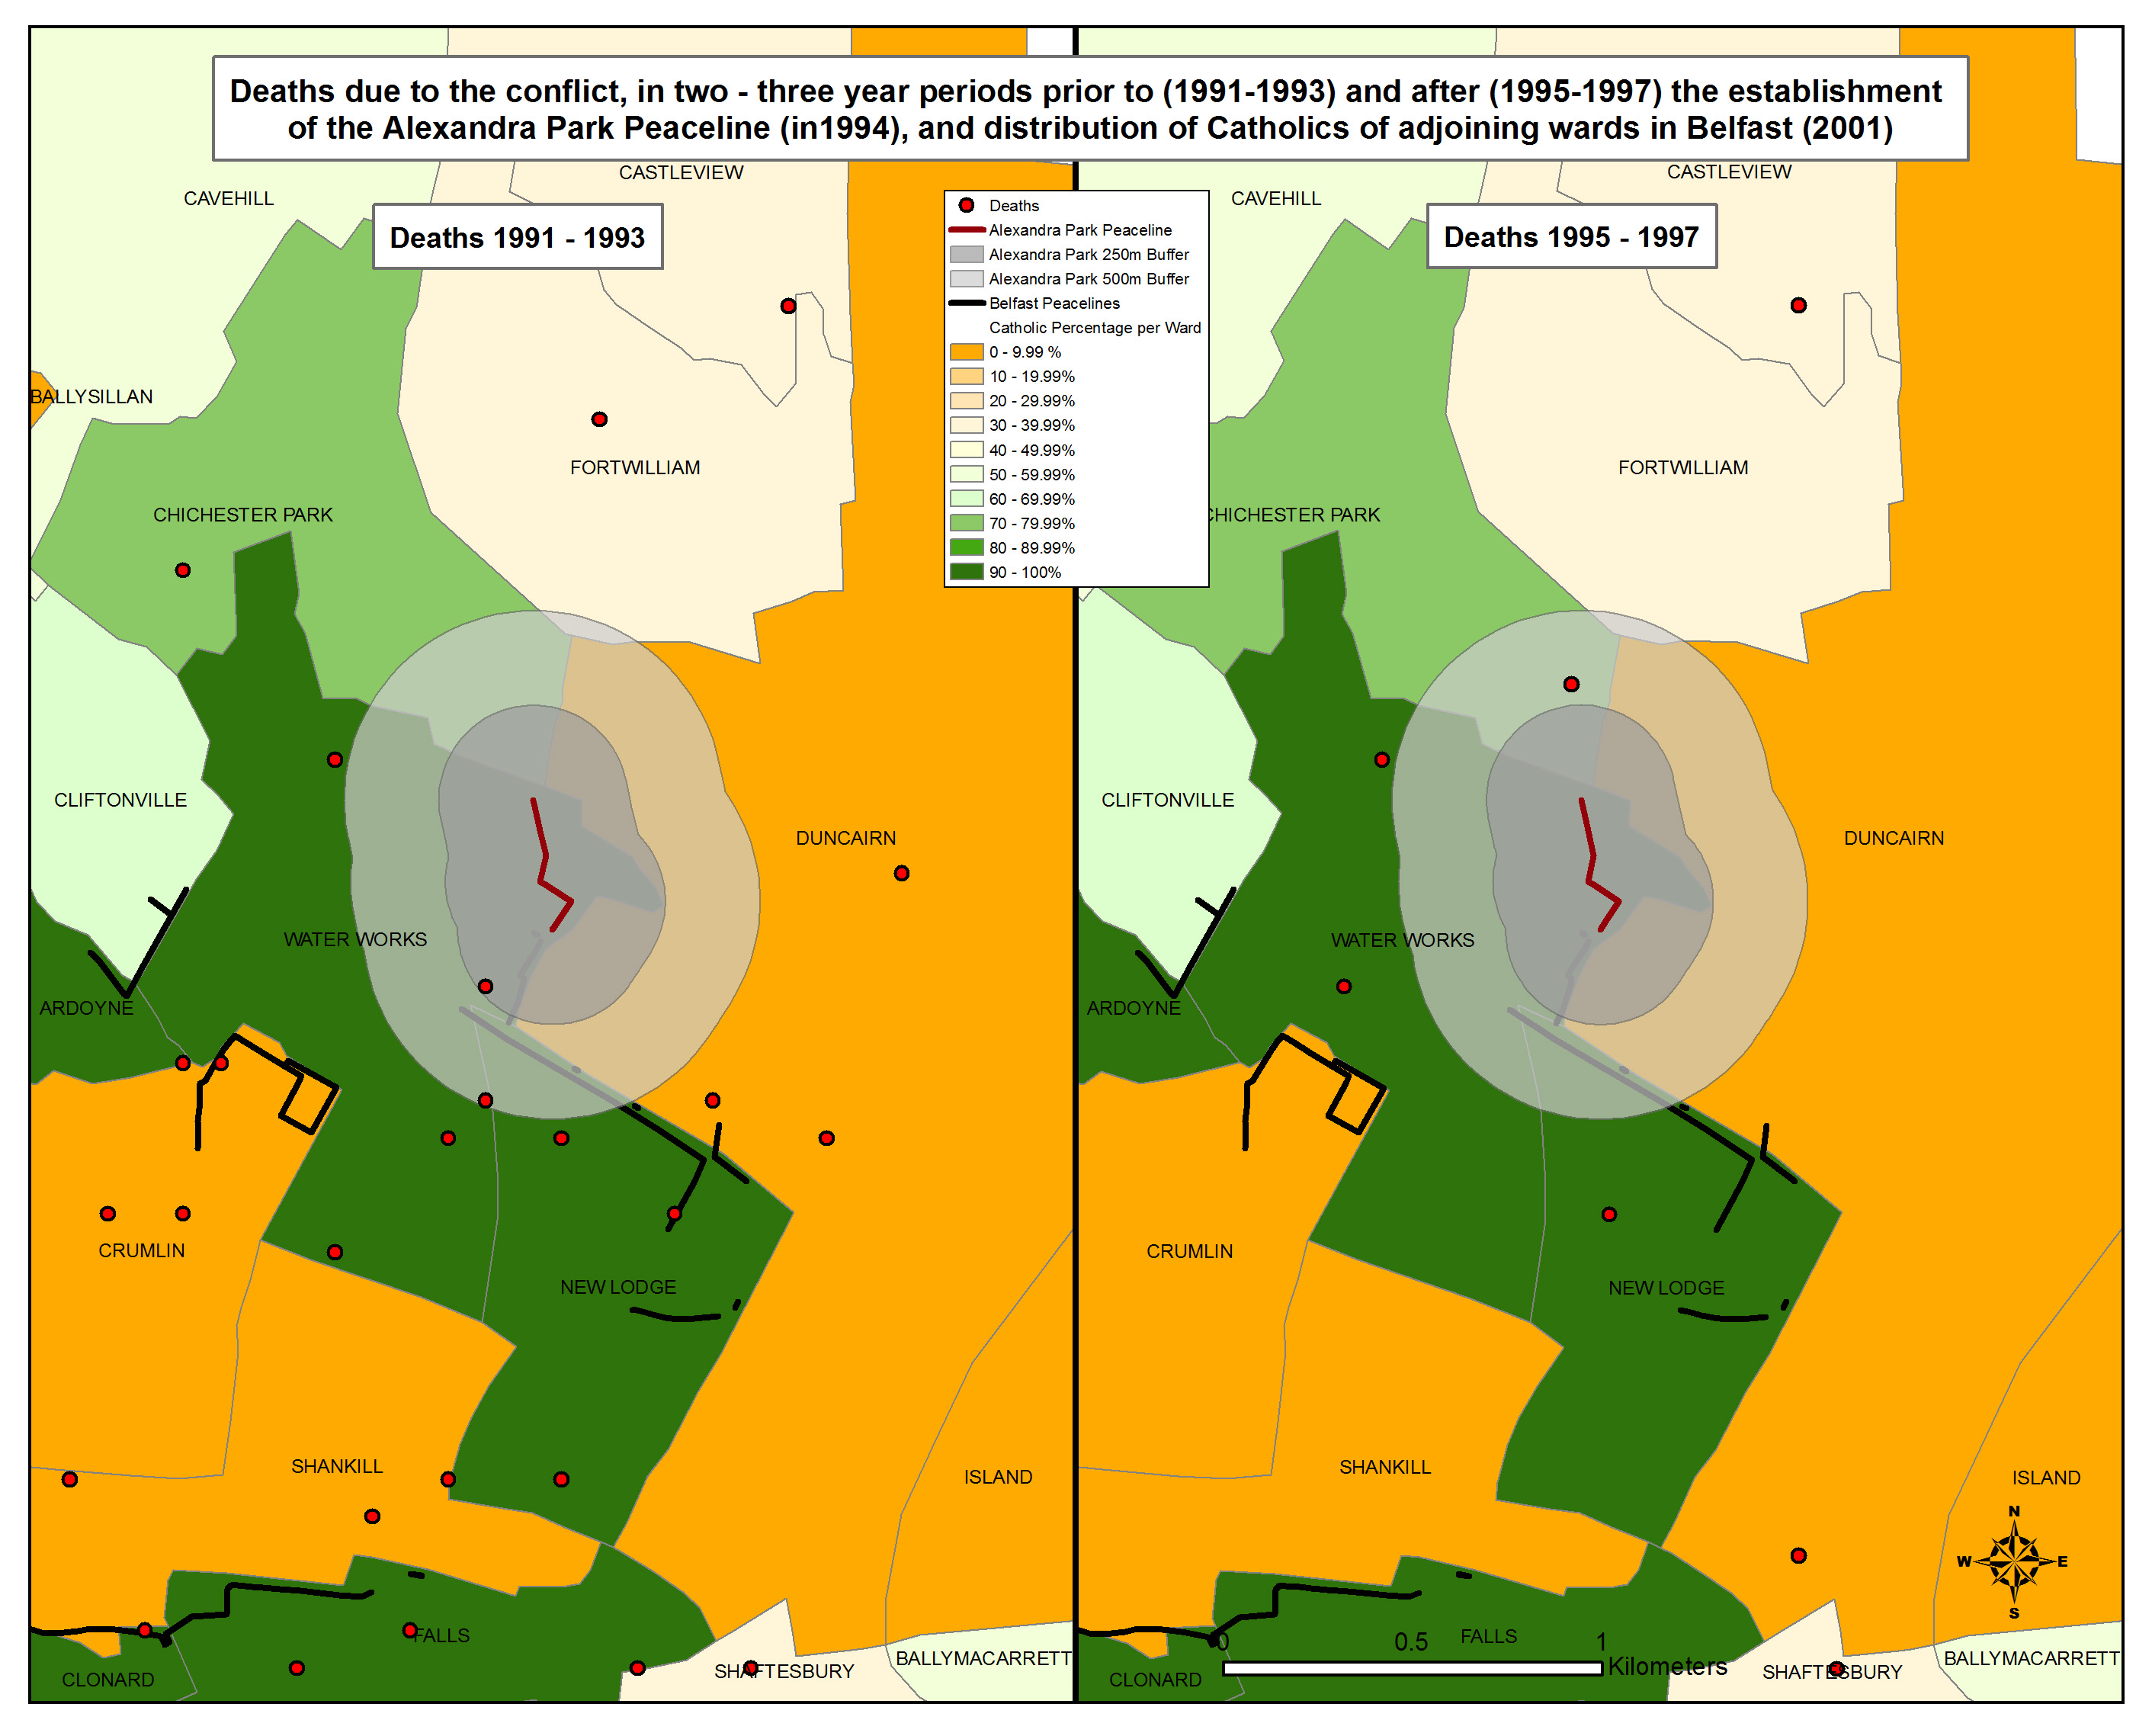
Deaths due to the conflict, in two three-year periods prior to (1991-1993) and after (1995-1997) the establishment of the Alexandra Park Peaceline (in 1994), and distribution of Catholics of adjoining wards in Belfast (2001). |
.pdf
345kb |
.jpg
248kb |
.jpg
1057kb |
Deaths - Peaceline - Alliance Avenue
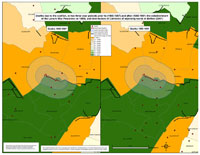
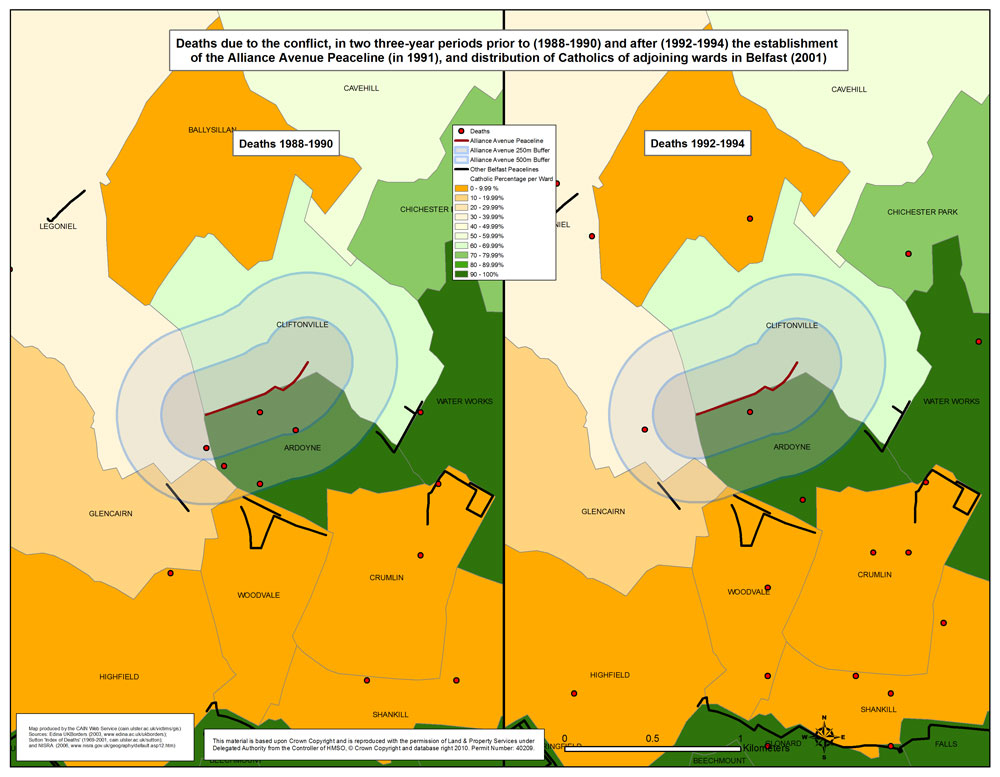
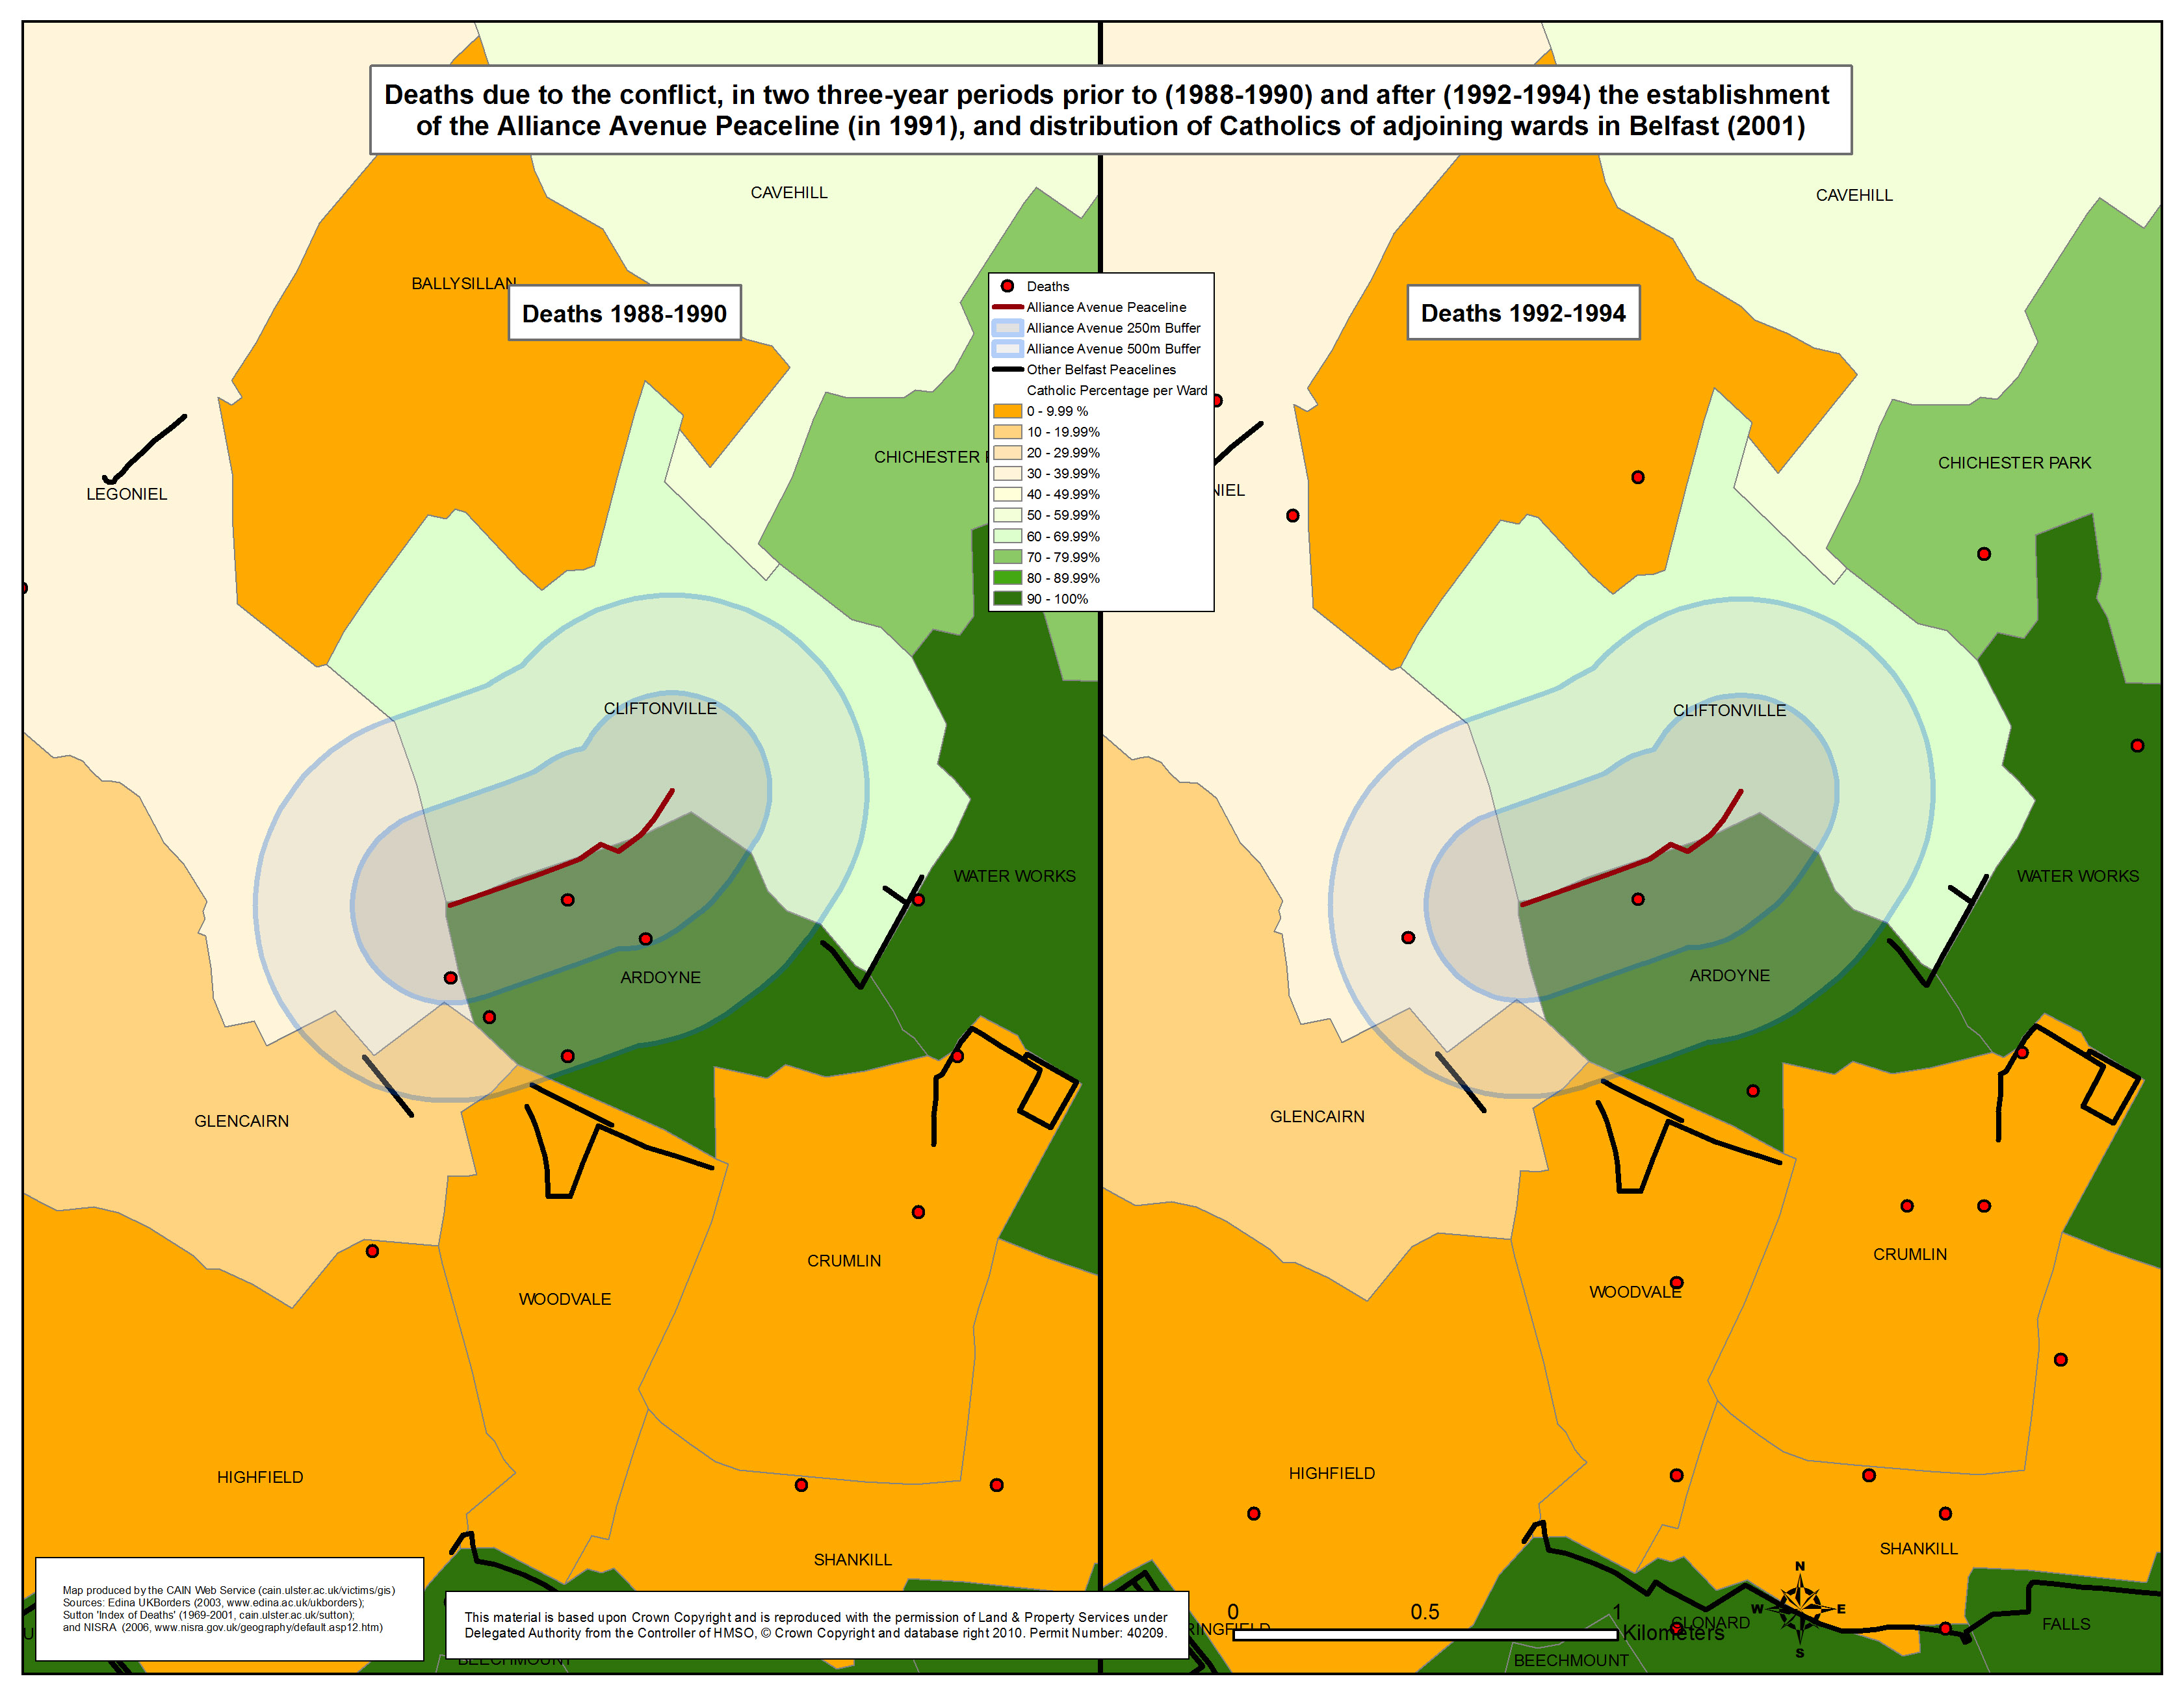
Deaths due to the conflict, in two three-year periods prior to (1988-1990) and after (1992-1994) the establishment of the Alliance Avenue Peaceline (in 1991), and distribution of Catholics of adjoining wards in Belfast (2001). |
.pdf
440kb |
.jpg
132kb |
.jpg
1159kb |
 Deaths - Peaceline - Lanark Way Deaths - Peaceline - Lanark Way
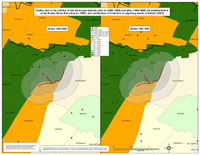
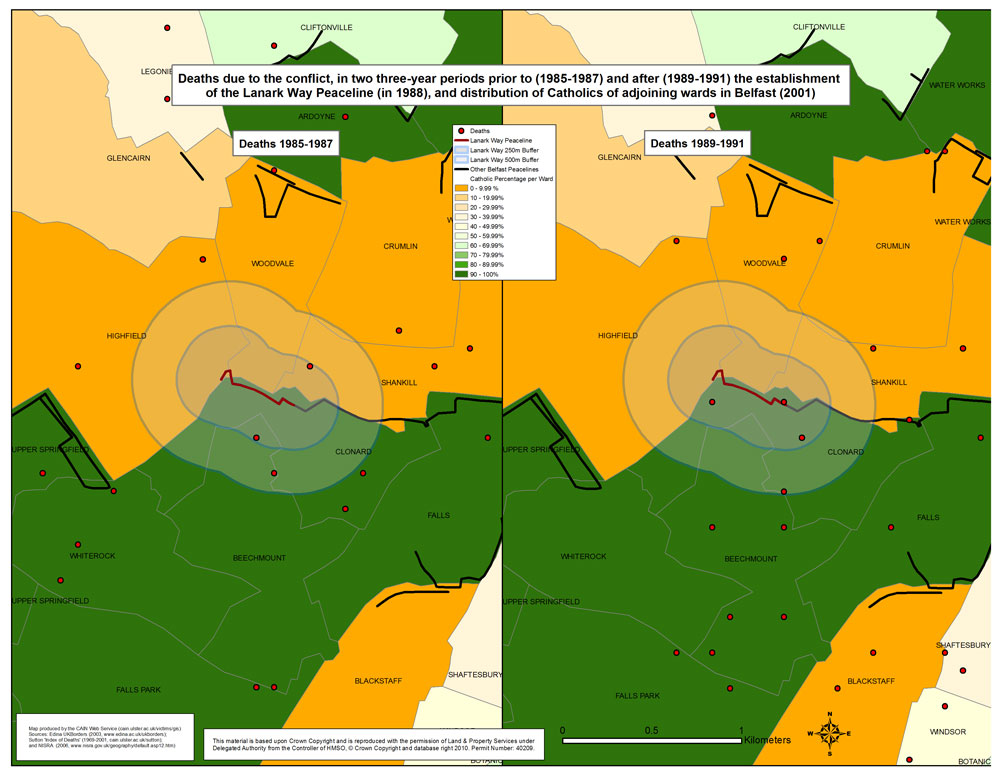
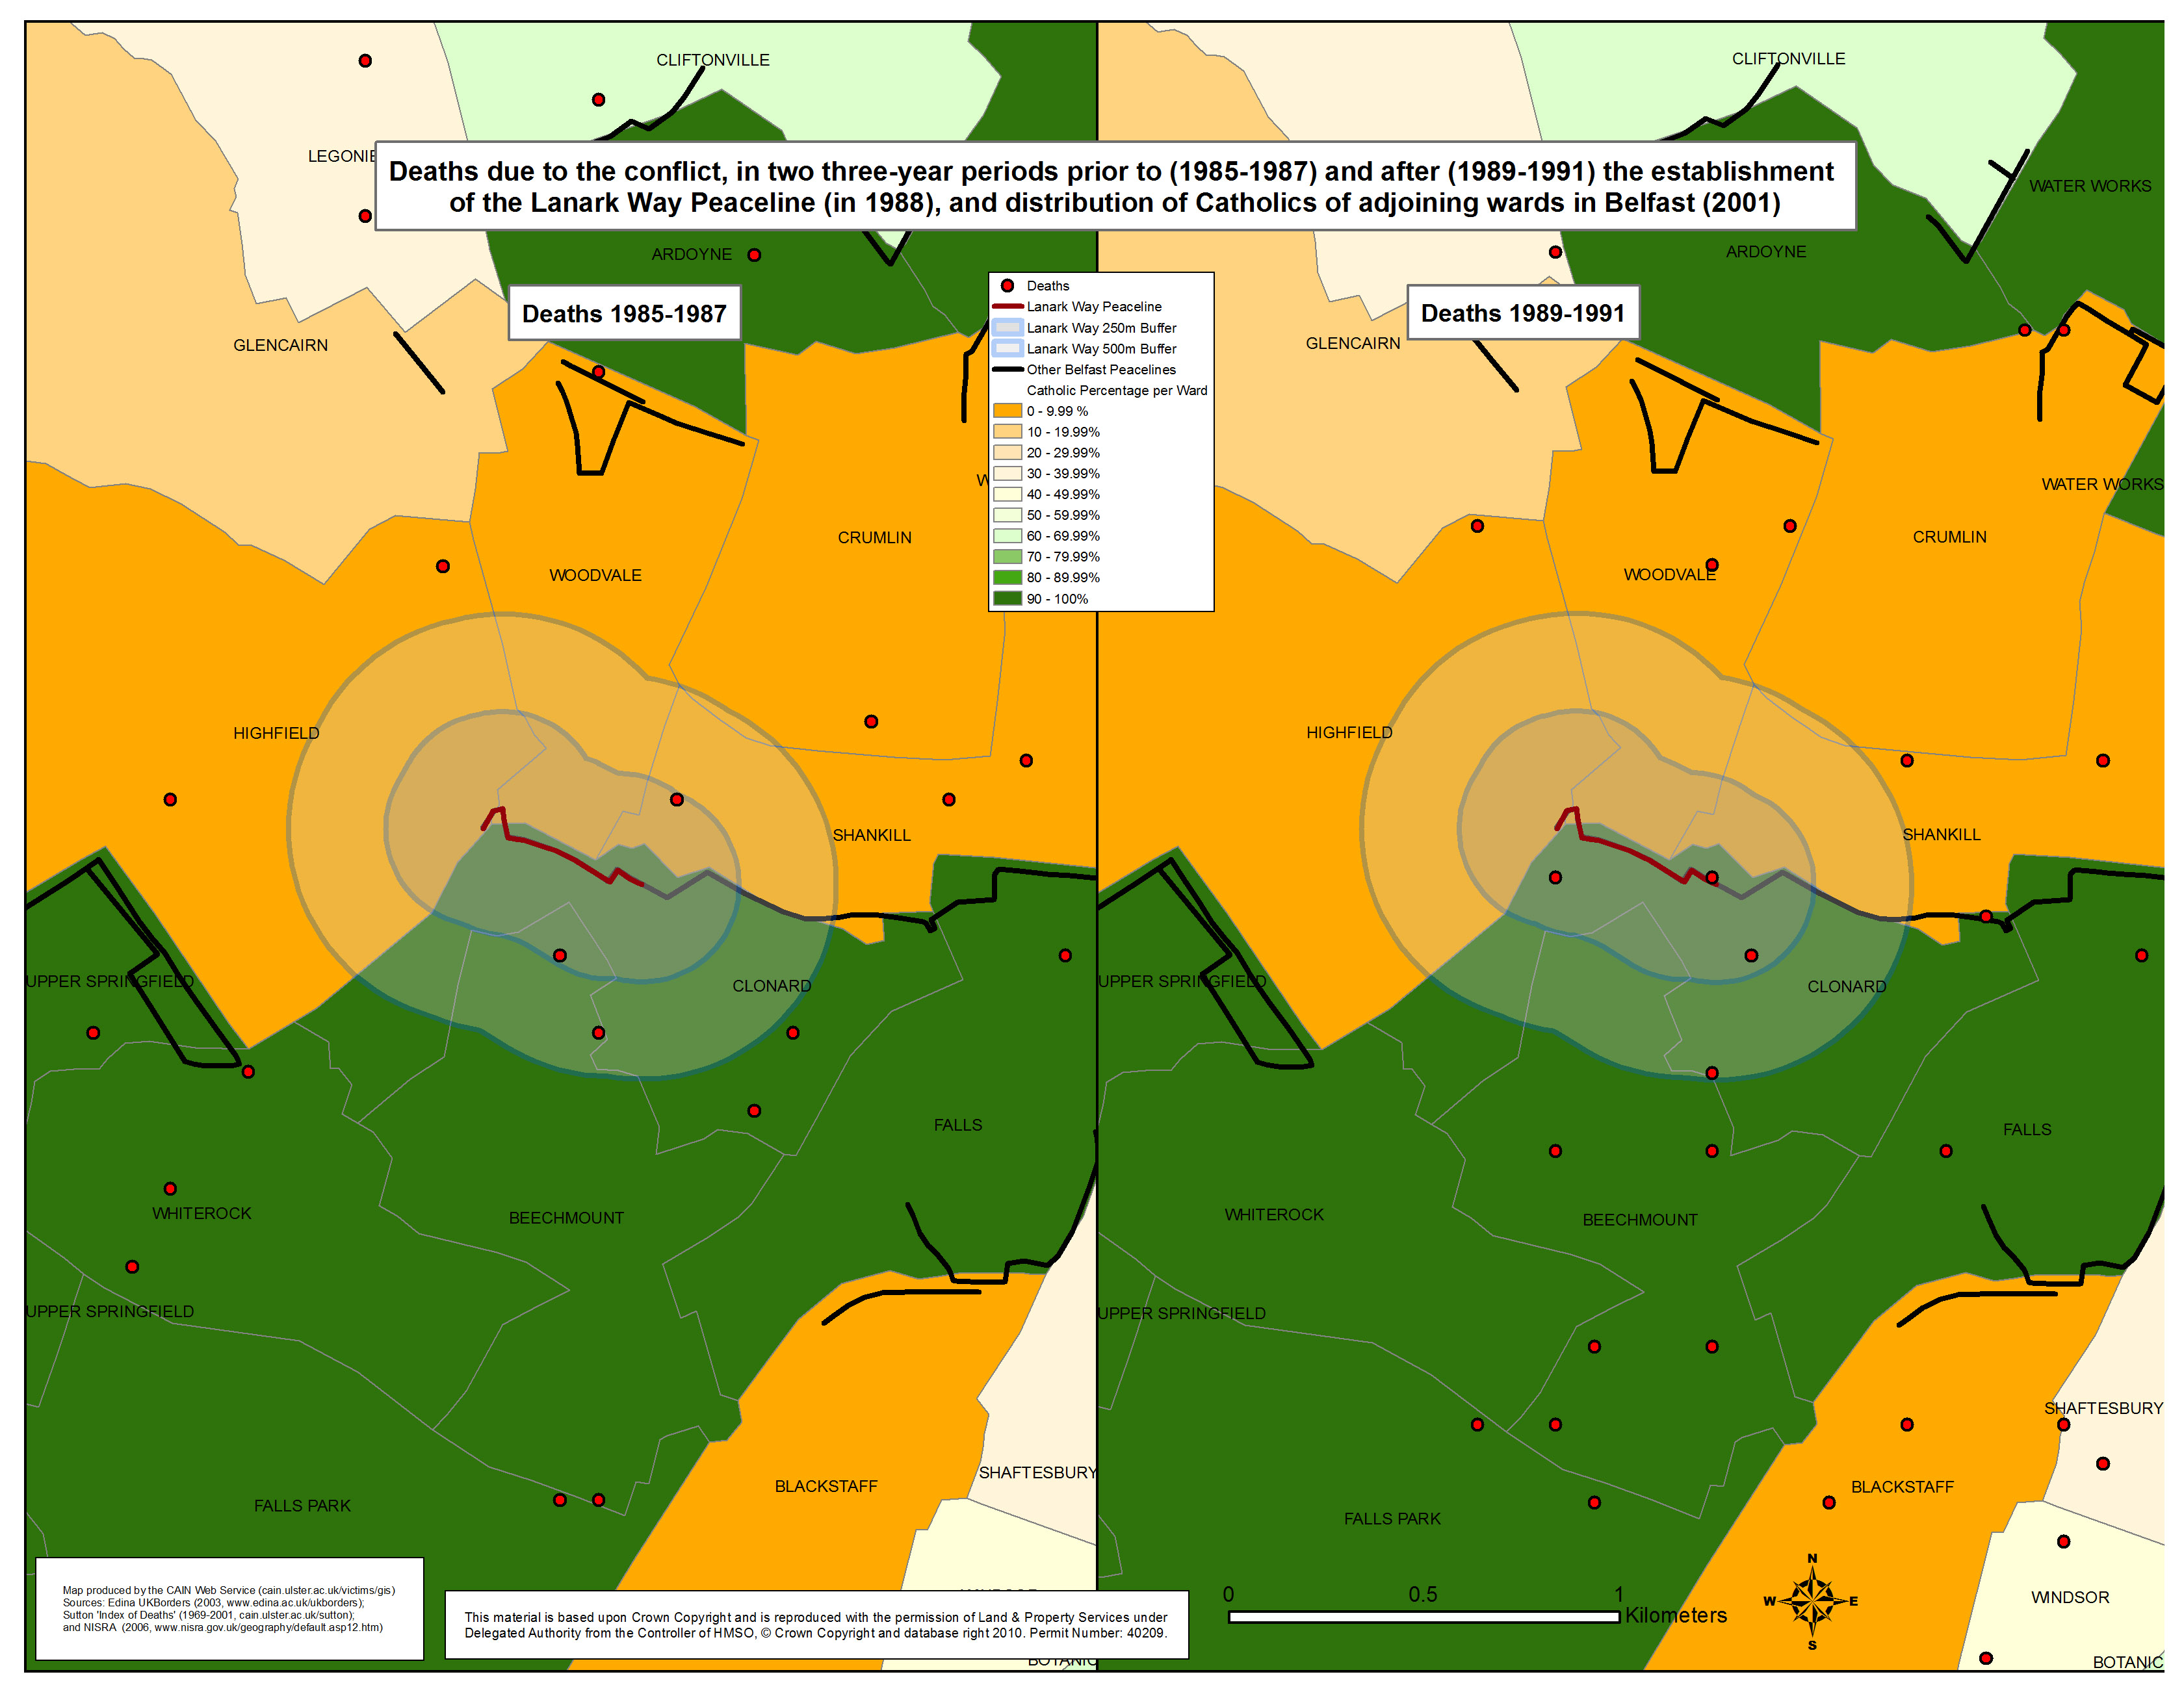
Deaths due to the conflict, in two three-year periods prior to (1985-1987) and after (1989-1991) the establishment of the Lanark Way Peaceline (in 1988), and distribution of Catholics of adjoining wards in Belfast (2001). |
.pdf
453kb |
.jpg
138kb |
.jpg
1224kb |
 Deaths - Peaceline - Roden Street Deaths - Peaceline - Roden Street
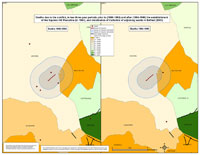
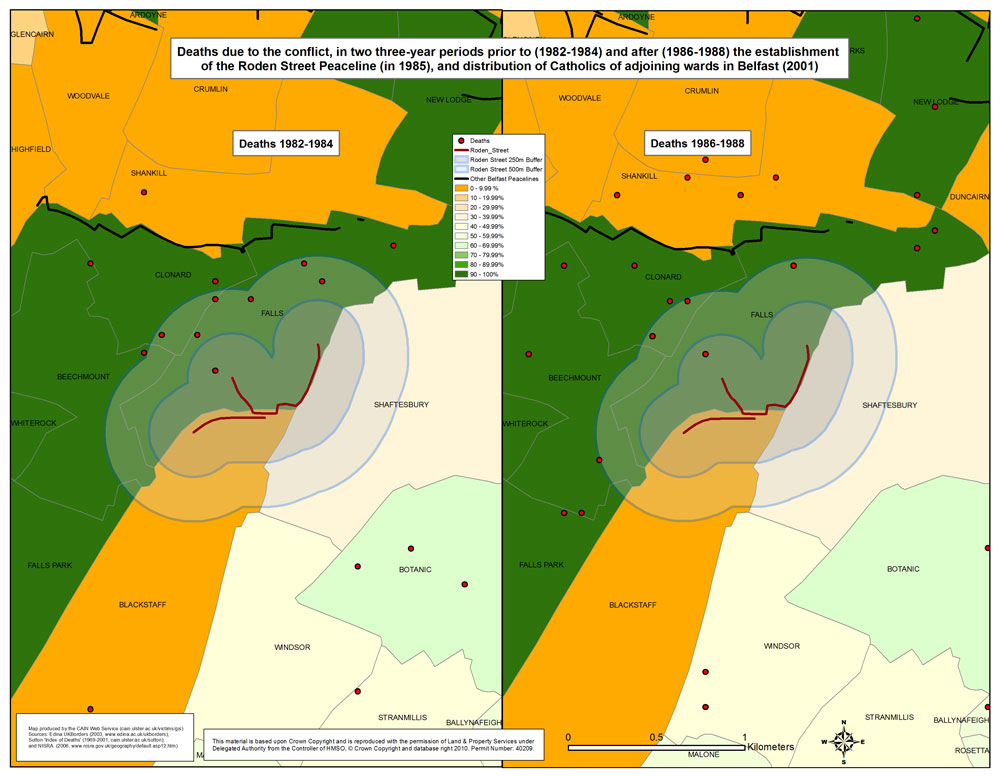
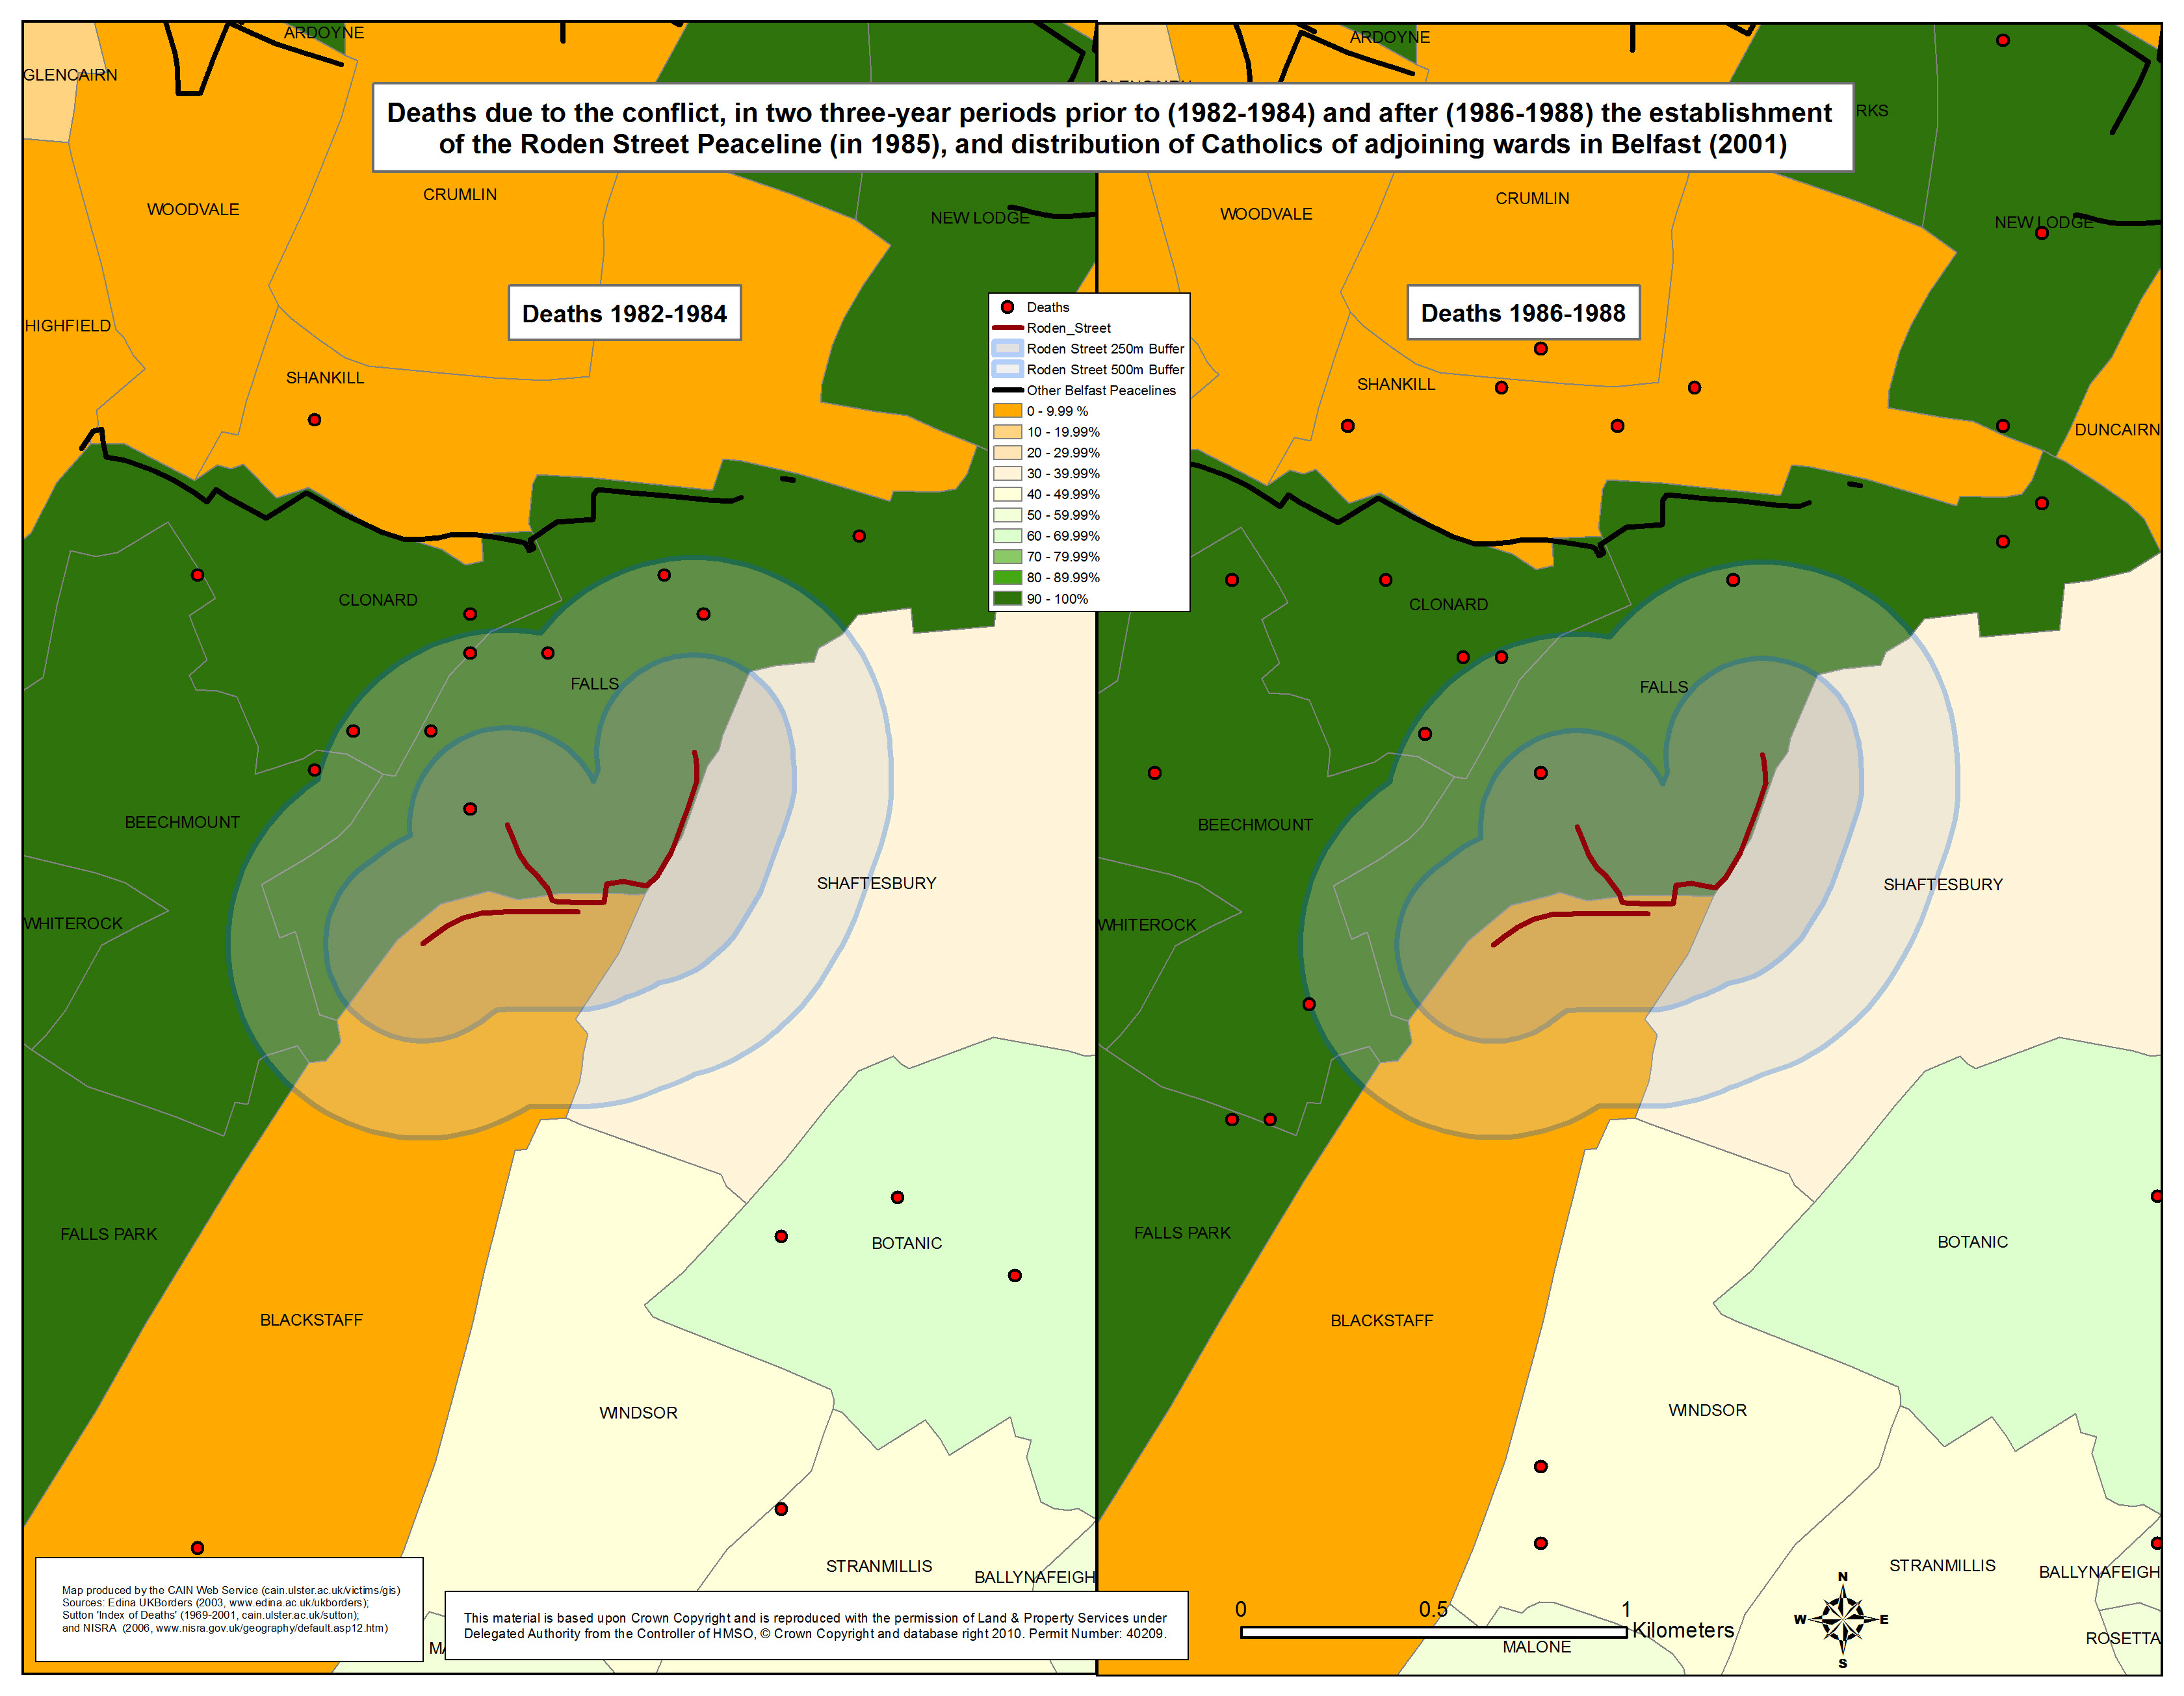
Deaths due to the conflict, in two three-year periods prior to (1982-1984) and after (1986-1988) the establishment of the Roden Street Peaceline (in 1985), and distribution of Catholics of adjoining wards in Belfast (2001). |
.pdf
455kb |
.jpg
133kb |
.jpg
1207kb |
 Deaths - Peaceline - Squires Hill Deaths - Peaceline - Squires Hill
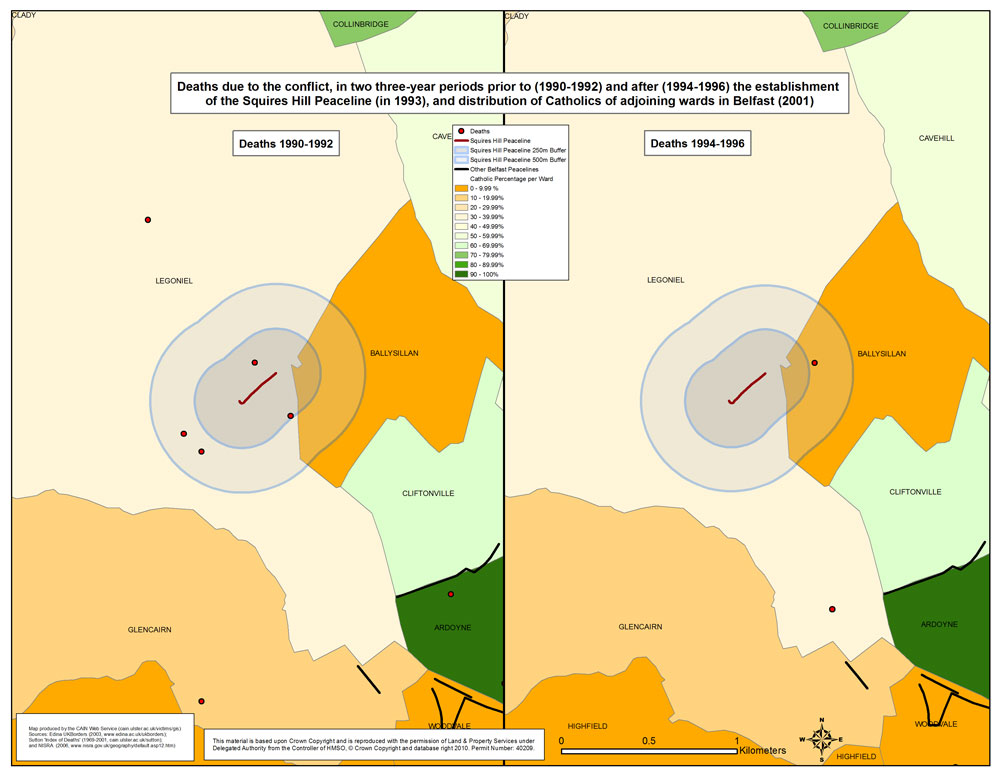
Deaths due to the conflict, in two three-year periods prior to (1990-1992) and after (1994-1996) the establishment of the Squires Hill Peaceline (in 1993), and distribution of Catholics of adjoining wards in Belfast (2001). |
.pdf
392kb |
.jpg
108kb |
.jpg
977kb |
 Deaths - Peaceline - Townsend Street Gate Deaths - Peaceline - Townsend Street Gate
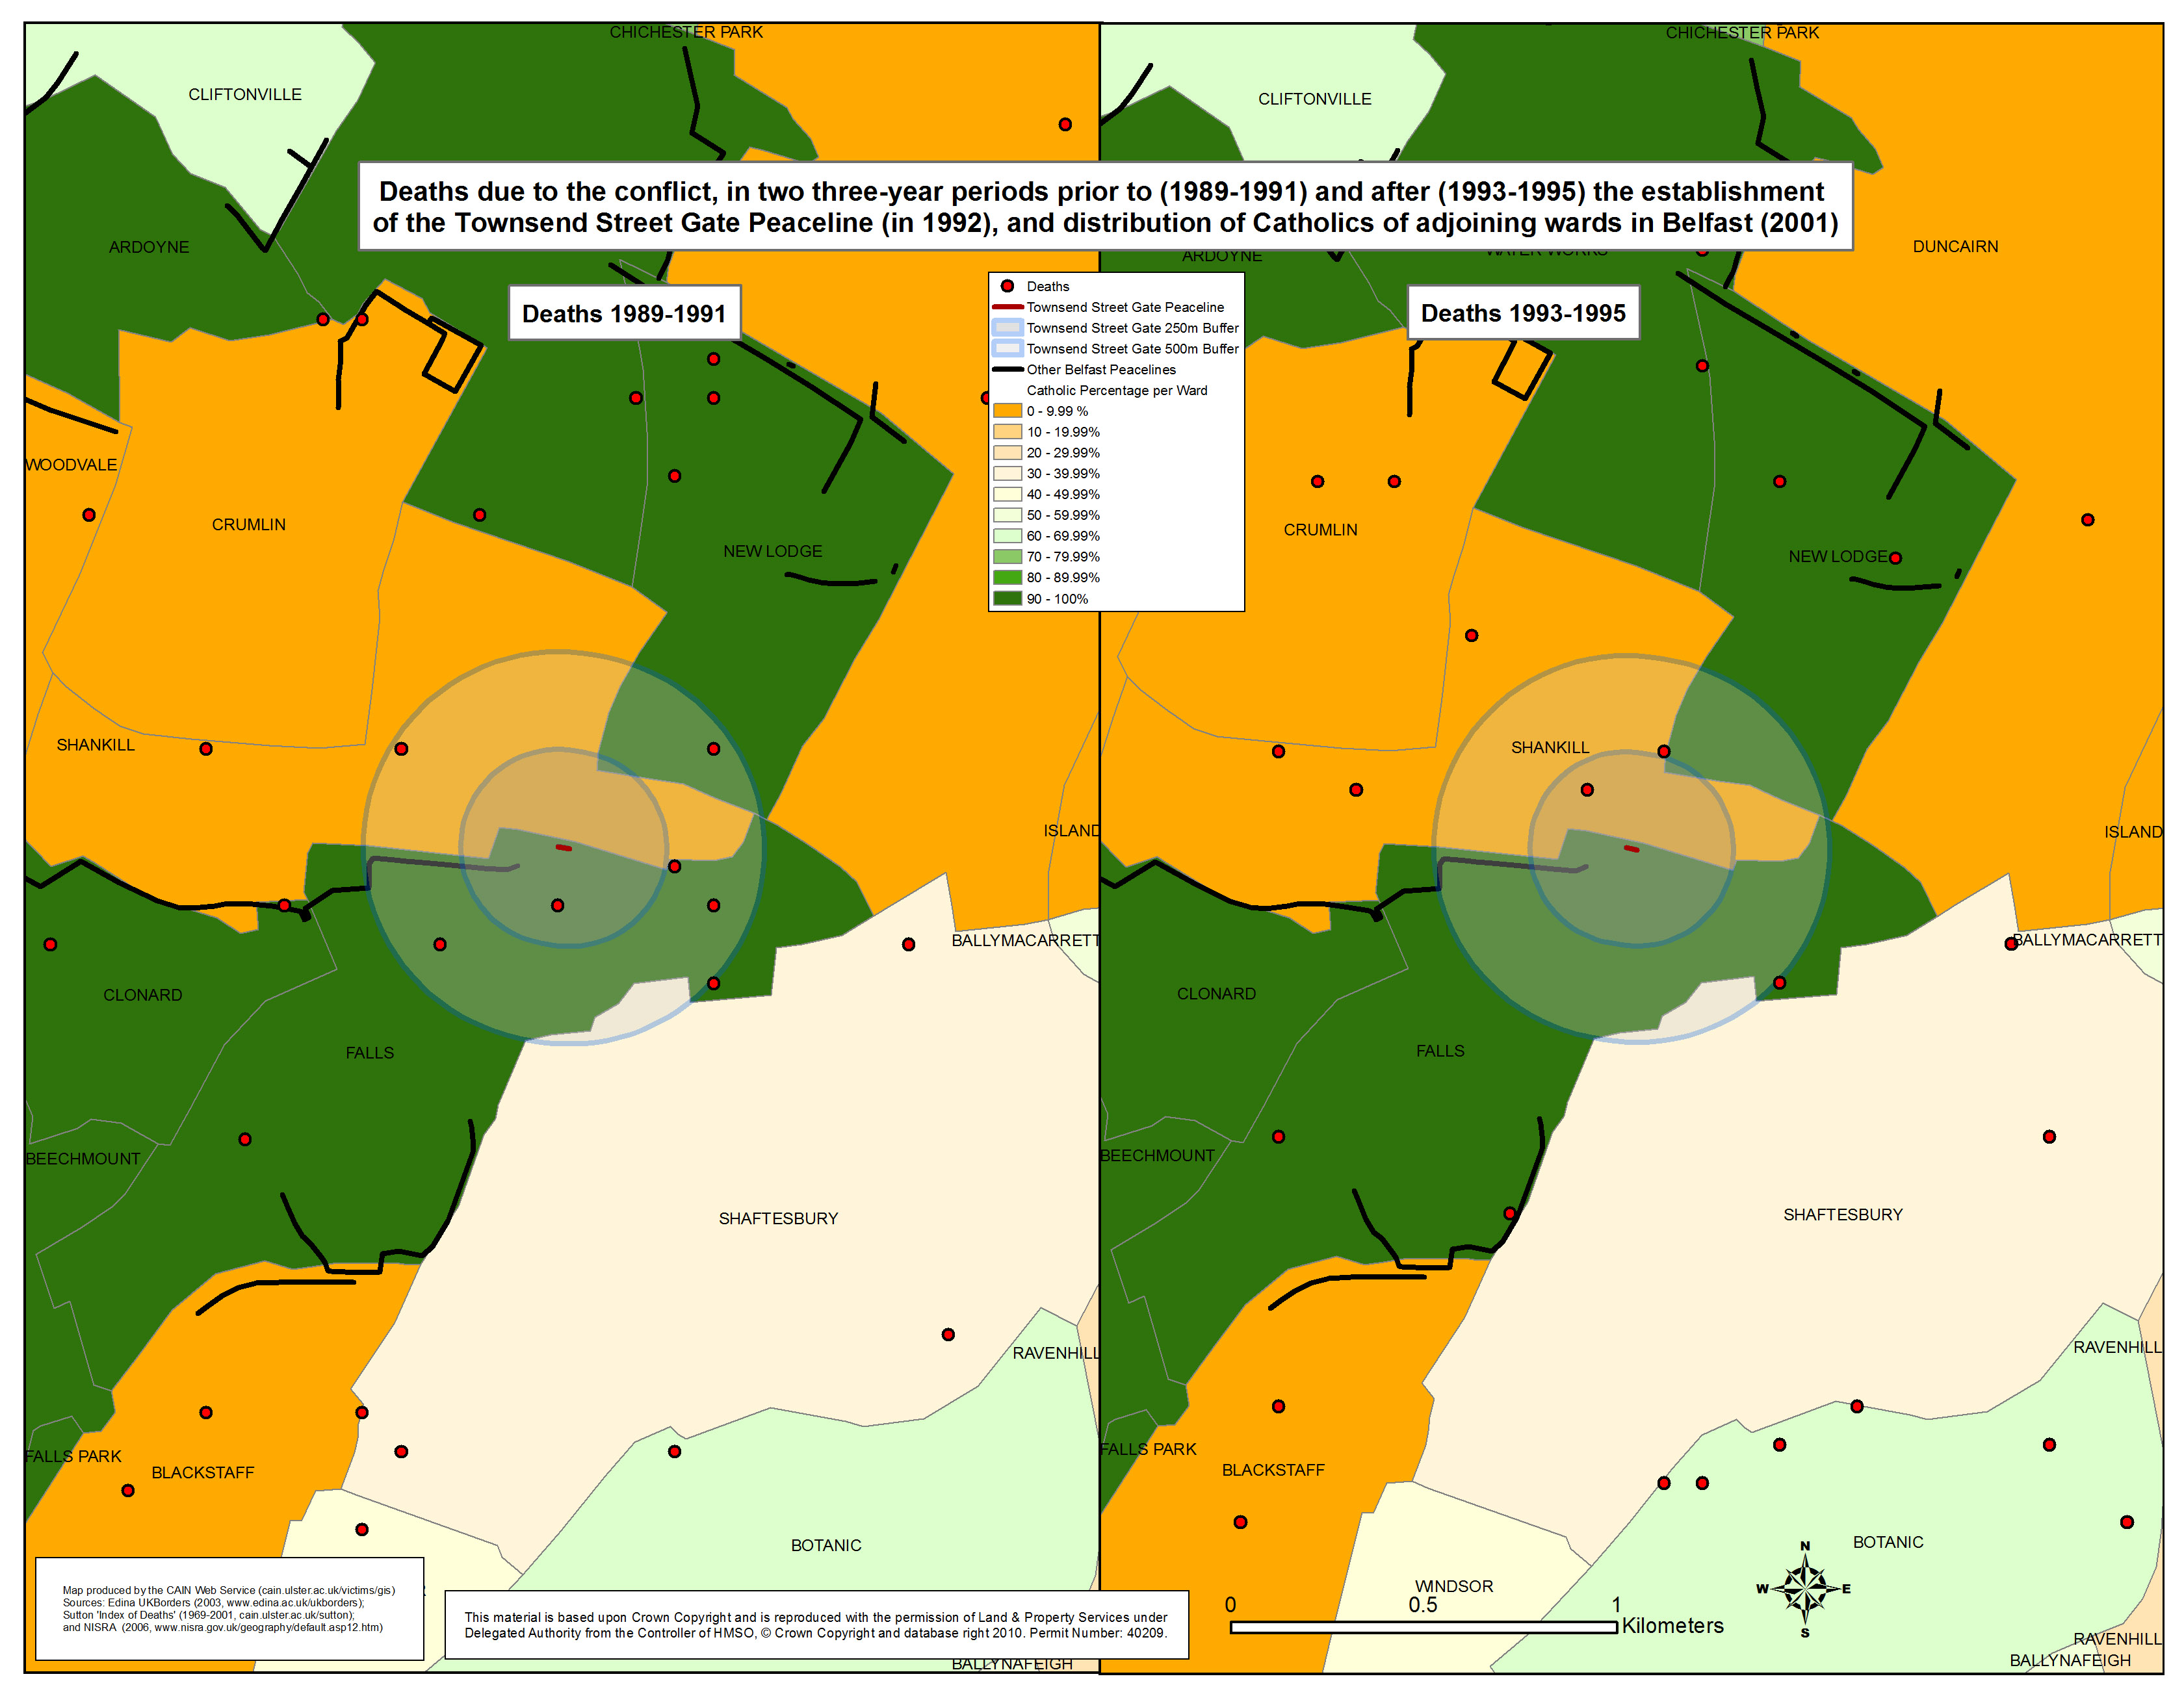
Deaths due to the conflict, in two three-year periods prior to (1989-1991) and after (1993-1995) the establishment of the Townsend Street Gate Peaceline (in 1992), and distribution of Catholics of adjoining wards in Belfast (2001). |
.pdf
457kb |
.jpg
136kb |
.jpg
1203kb |
 Deaths - Peaceline - Workman Avenue Gate Deaths - Peaceline - Workman Avenue Gate
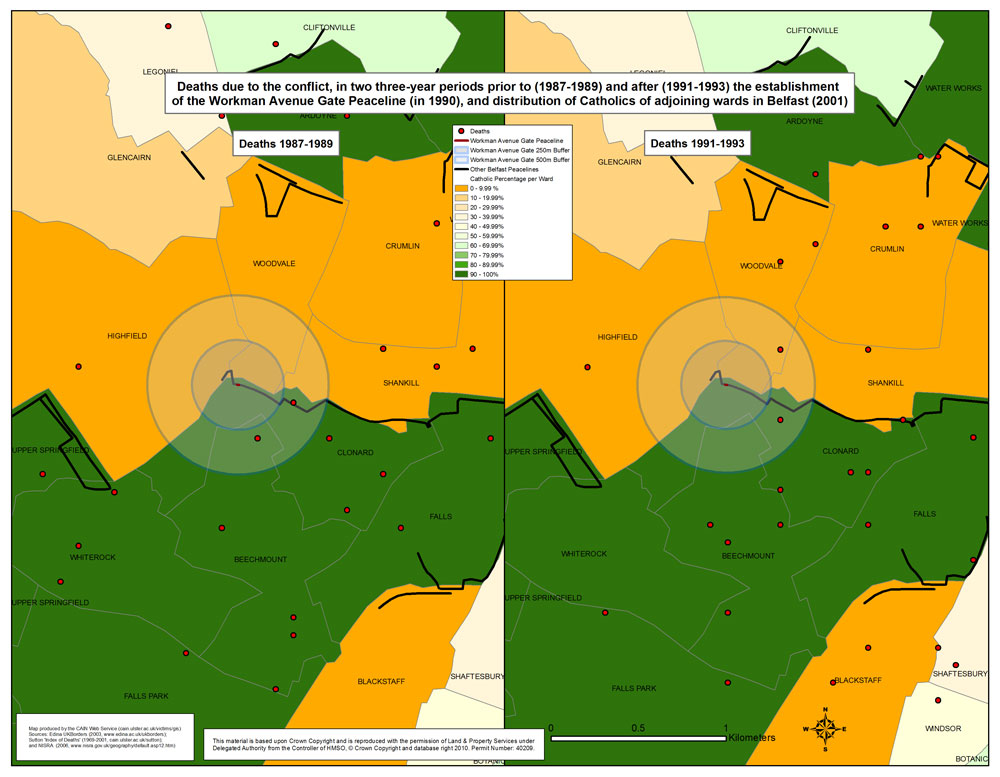
Deaths due to the conflict, in two three-year periods prior to (1987-1989) and after (1991-1993) the establishment of the Workman Avenue Gate Peaceline (in 1990), and distribution of Catholics of adjoining wards in Belfast (2001). |
.pdf
454kb |
.jpg
139kb |
.jpg
1233kb |
| Peaceline Maps - Commentary - Martin Melaugh |
One thing Belfast is internationally famous for, besides the Titanic, is its peacelines. It is true that there are many organisations which would like to see the peacelines removed. It is difficult to present Northern Ireland as a ‘normal’ society when huge swathes of Belfast are broken up by a couple of dozen peacelines. However, those families who live either side of the sectarian interfaces are not yet demanding in great numbers that they should be removed.
Despite the political developments before and after the 1998 Good Friday Agreement many families feel safer with the walls in place. There have been some recent attempts at small initiatives. For example, a gate in a peaceline that runs through Alexandra Park in north Belfast was opened in September 2011 during daylight hours for a trial period of three months (BBC NIWeb site, 16 September 2011). However, since 1998 there have been new peacelines installed, existing ones extended both in height and length, but no single peaceline has been removed.
Given their apparent permanence it might be natural to ask for objective evidence that the peacelines do indeed reduce violence. The availability of map X/Y co-ordinates for Sutton’s Index of Deaths provided an opportunity to carry out a first tentative appraisal of some of the information. The basic idea was to look at the pattern of deaths in the years prior to the installation of a peaceline and the deaths in the years immediately after the building of the wall.
A first question is how many peacelines are there in Northern Ireland? There appears to be some disagreement on the number. CAIN states the following in its Glossary of Terms:
There were approximately 35 peacelines in existence by 2001. Of these 26 were in Belfast, mainly in the west and north of the city. Outside of Belfast there were 6 peacelines in Derry, 2 in Portadown, and 1 in Lisburn. By 2007 the number of peacelines had grown to 46 walls or fences and 11 gates (Belfast Telegraph 26 April 2007).
However, whenever researchers approached the Northern Ireland Statistics and Research Agency (NISRA) to obtain the shapefiles for the peacelines in Belfast, they were told there were 22 peacelines in Northern Ireland. The apparent discrepancy may be due to different agencies being responsible for the building and maintenance of different peacelines, or it may partly be due to the joining of some peacelines which might be considered as separate walls by other groups and organisations.
The next basic question was when were the peacelines built? This is where the research plan ran into a wall of its own. Those with responsibility for the peacelines were only able to provide specific dates of construction for seven of the walls out of the 22 for which shapefiles were available. To obtain dates for the other 15 peacelines would probably require quite a bit of library research and unfortunately the project could not afford the time. So rather than a detailed statistical analysis of the full set of data the researchers settled for a tentative exploration of the information for the seven peacelines above.
One additional point had to be considered and that was the ‘background’ level of violence. The number of deaths from the conflict reached a peak in the years 1971 to 1976, dropped to a plateau between 1977 and 1994, before dropping again to lower levels between 1995 and 2001 (the end of Sutton’s records). The plan was to look at deaths over a three-year period prior to the construction of the peaceline, to ignore the year of construction, and to look at deaths for three years after the peaceline was completed. This gives a span of seven years for each peaceline during which time a general background decline in the level of violence could have an impact on an area regardless of the presence or absence of a peaceline. It is also necessary to account for the fact that the dates of construction for the seven peacelines cover a 10-year span, i.e., they were built in: 1985, 1988, 1990, 1991, 1992, 1993, and 1994.
The Maps are discussed below in alphabetical order.
Alexandra Park
The first is for the peaceline in Alexandra Park in Belfast. While there is a decline from two deaths to one death within the 500 metre buffer zone around the peacline this would not be consider significant. As the three-year period after the construction of the peaceline covers the years 1995-1997 this corresponds to the decline in deaths following the first IRA ceasefire. It is clear from the two maps that there are many fewer deaths across the total area enclosed by the full maps.
Alliance Avenue
The two maps for Alliance Avenue show a decline from five deaths before the peaceline to two deaths after within the 500 metre buffer zone. It is interesting to note that the overall number of deaths within the full boundaries of the two maps increases over the period. The two maps offer tentative indications of a peaceline having an impact on the number of deaths within its immediate shadow. However, it raises a question as to whether the deaths have been displaced to places not ‘covered’ by the peaceline. This question might be partially answered by examing the details of each individual death to see which organisations were responsible and whether they were likely to be operating across the interface area.
Lanark Way
The maps for Lanark Way show an increase of one deaths for the periods before and after the construction of the peaceline. This probably reflects the background increase in total deaths within the boundaries of the two maps.
Roden Street
The Roden Street maps show a decline in deaths from eight to five against a background increase over the seven year period. Again this decline in deaths following the construction of the peaceline can only be regarded as indicative of a possible influence of the presence of the wall.
Squires Hill
The two maps for Squires Hill probably show that other factors, notably the first IRA ceasefire in 1994, were more likely to have been responsible for the decline in deaths from four to one in the immediate vicinity of the peaceline which was constructed in 1993. The overall decline in deaths was from seven to two.
Townsend Street Gate
The maps for the Townsend Street Gate show a decline in deaths from six to two. The background level of deaths also declined but not to the same extent. Again this decline in deaths in the buffer zone around the peaceline would probably merit further research.
Workman Avenue Gate
The number of deaths within the buffer zone for the Workman Avenue Gate remains constant at two deaths before and after the construction of the peaceline. The background number of deaths shows a slight increase between the two three-year periods.
Number of deaths due to the conflict close to selected peacelines in Belfast, in two three-year periods prior to and after the establishment of the peaceline
|
Number of Deaths |
| Peaceline (Date built) |
500m Buffer |
500m Buffer |
250m Buffer |
250m Buffer |
| |
Before |
After |
Before |
After |
| |
< 3 years |
> 3 years |
< 3 years |
> 3 years |
| Alexandra Park (1994) |
2 |
1 |
1 |
0 |
| Alliance Avenue (1991) |
5 |
2 |
3 |
1 |
| Lanark Way (1988) |
3 |
4 |
2 |
3 |
| Roden Street (1985) |
8 |
5 |
1 |
1 |
| Squires Hill (1993) |
4 |
1 |
2 |
0 |
| Townsend Street Gate (1992) |
6 |
2 |
1 |
1 |
| Workman Avenue Gate (1990) |
2 |
2 |
0 |
0 |
Source:
Table based on Sutton's 'Index of Deaths' (1969-2001); Belfast Interface Project; Northern Ireland Statistics and Research Agency (NISRA)
Acknowledgement:
Table compiled by Luke Kelleher, then a Research Associate with CAIN.
Conclusion
As mentioned above, to do a full analysis of the impact of peacelines on deaths would require a full examination of all the 22 peace walls. In addition a proper statistical analysis of the differences in deaths would have to take account of the background level of deaths. This would also have to be supplemented by a detailed reading of the details of each individual death to see if the particular circumstances were likely to have been impacted by an interface peaceline.
The peacelines shapefile was downloaded from the Northern Ireland Statistics and Research Agency (NISRA) Web site:
http://www.nisra.gov.uk/geography/Home.htm
The religious background data was downloaded from the Northern Ireland Statistics and Research Agency
(http://www.nisranew.nisra.gov.uk/census/Census2001Output/
KeyStatistics/ks_settlements.html#settlement%20%20tables)
The table used was titled Table 7S07b Community Background: Religion or Religion Brought Up In
The electoral ward shapefile was downloaded from EDINA borders website. (http://borders.edina.ac.uk/html/lut_download/ni_ward.html)
The GIS maps listed above have been produced as part of the AHRC 'Visualising the Conflict' Project. The maps have been reproduced and made available with the permission of Land & Property Services under Delegated Authority from the Controller of HMSO, © Crown Copyright and database right 2010; Permit Number: 40209.
All maps were prepared by Luke Kelleher, then a Research Associate (GIS) working with CAIN. All maps were sized A4 (approximately). GIS software was used to produce TIFF versions (A4 approx; 300dpi) which are available on request. Three versions of each map have been made available above:
- PDF versions (A4 approx; 300dpi) are based on original TIFF files.
- L-JPG versions (1000px700p approx; 72dpi) are low resolution JPEG images.
- H-JPG versions (A4 approx; 300dpi) are high resolution JPEG images.
As in the case of other maps the drawing of the maps involved a number of decisions which can impact on the the results. In this case the main decision was the extent of the area around a peaceline to include in the mapping. As the peacelines were all in urban areas it was decided to look at two 'buffer' areas that were 250 metres and 500 metres around each peaceline. These distances were selected to reflect the possible extent of the range of influence of the peaceline. However, the maps do not take account of the complicated geography of roads and paths that cross the interface at either end of the barrier wall.
Return to List of Map Sets
|
